Spectral Derivatives
Derivative Spectroscopy is a method where the nth-order derivative of the absorbance with respect to the wavelength, for each point on the absorption spectrum, is calculated. Of particular interest is the ability of derivative spectroscopy to eliminate background and suppress baseline due to the sample matrix.
The absorption spectrum of a pure compound often approximates a Gaussian curve as shown in Figure 1. The derivative of a Gaussian curve has a distinct waveform as is illustrated for the third derivative of this Gaussian in Figure 2.
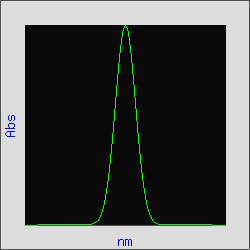 Figure 1. Gaussian Curve
|
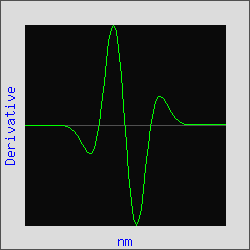 Figure 2. Third Derivative of Gaussian
Curve
|
Figure 3 is the plot of a Gaussian curve with an added linear "baseline". By applying the third derivative, this baseline is eliminated as in Figure 4. For absorption spectra, the amplitude (A) of the peaks are inversely proportional to the spectral bandwidth (W) raised to the nth order of the derivative, or An = 1/Wn (Owen, Aligent Technologies, publication 5963-3940E). In the example below, the linear "baseline" has an infinite spectral bandwidth and therefore its amplitude will approach zero; facilitating the resolution of the peaks of interest.
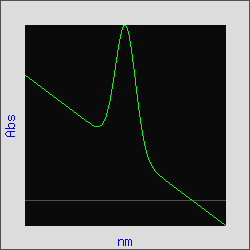 Figure 3. Gaussian curve with a
linear baseline added.
|
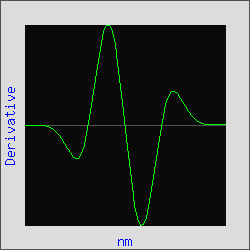 Figure 4. Third derivative of Gaussian
curve with a linear baseline added.
|
Savitzky-Golay
The NWLSS™ Derivative Spectroscopy Application applies the well known method of Savitzky-Golay (Savitzky, A., and Golay, M. (1964) Analytical Chemistry 36:8, 1627-1639) to a given absorption spectrum. A polynomial, typically 3rd-5th-order, is fit over a continuous set of points (filter) on the spectrum. The nth order derivative of this polynomial is then calculated and assigned to p, the mid-point of the filter. This process is repeated for all points as p is incremented by one.
| Determining the derivative of an absorption spectrum as described above is computationally intensive and inefficient. Equation 1 is numerically equivalent to the above procedure (Numerical Recipes in C). A convolution key, composed of a set of weighting factors (coefficients) can be determined given the order of the polynomial, the order of the derivative and the length of the filter. Foe example, the 3rd-derivative convolution key for a 3rd-order polynomial is shown in Figure 5. |
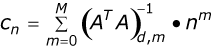 where Cn = Coefficients M = Polynomial order A = |ij| d = Derivative order m = 0,...,M f = Filter length n=-½(f-1),...,0,...,½(f-1) Equation 1. |
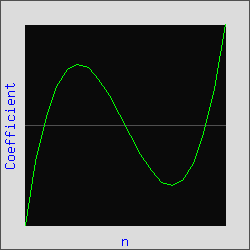 Figure 5. Convolution key for the third derivative of a 3rd-order polynomial.
|
Parameters
Different assays and sample types produce different absorption spectra. The NWLSS™ Derivative Application offers analytical flexibility that requires the user to enter 3 parameters; the order of the polynomial, the order of the derivative and the length of the filter. Optionally, a scaling factor can be entered. Below is a description and requirements of each of these parameters.
Polynomial Order (M) The order of the polynomial to be used to create the convolution key. This value must be greater than or equal to the order of the derivative and less than the filter length. Generally, a polynomial
order between 3 and 5 is recommended.
Derivative Order (d) The order of the derivative to be used to create the convolution. This value must be less than or equal to the order of the derivative. Depending on the experiment's objective, a derivative order of 2-4 is recommended.
Filter Length (f) The number of points in the convolution key is the filter (f) length. The natural band width (NBW, width of the absorption band at ½ the peak height) of the analyte is a good initial value for the filter length. The convolution filter is determined over an interval of equally spaced data points. Therefore, the resolution of the absorption spectrum must be considered. For example, if the NBW is used to select filter length and the resolution is 1 nm, then f=NBW). However, if the resolution is 0.5 nm, then f=2*NBW). Similarly, if the resolution is 2 nm, then f=NBW/2).
Scale A consequence of the derivative calculation is that the derivative values become very small numbers. The Scale (s) parameter is used to increase the magnitude of the convolution key to provide more convenient numbers. The overall results are not affected by the scale factor.
Data Upload
The experimental absorption spectra is easily uploaded to the NWLSS™ Internet server. The current version the the NWLSS™ Derivative Application requires the original data to be formatted as columns of numbers of equal length separated by a comma. Column headers for sample identification are allowed but must contain at least 1 non-numeric character. Examples of acceptable data formats are described below.
Local File Most spectrophotometers have utilities to output results to a text or comma separated data file (csv). The NWLSS™ derivative application will accept absorption spectra in two formats; data files with or without sample headers as shown in the table below.
| Data File Format Requirements | ||||||||||||||||||||||||||||||||||||||||||||||
|---|---|---|---|---|---|---|---|---|---|---|---|---|---|---|---|---|---|---|---|---|---|---|---|---|---|---|---|---|---|---|---|---|---|---|---|---|---|---|---|---|---|---|---|---|---|---|
Type XYXY with Headers
(example)
|
Type XYXY No Headers
(example)
|
|||||||||||||||||||||||||||||||||||||||||||||
Type XYY with Headers
(example)
|
Type XYXY No Headers
(example)
|
|||||||||||||||||||||||||||||||||||||||||||||
Local Files A local file is a CSV file located on the user's computer. To select a local data file, click on . The operating system's file selection wizard will be displayed. Select the appropriate file from the file wixard. The selected file's full name is then displayed in the input box.
Example Files Several data files are available for use as examples and practice. These files include a set of Gaussian curves that demonstrate the derivative application of an ideal absorption spectra; including a linear baseline added to the Gaussian curve. The other example data files are from an MDA assay using the NWLSS™ NWK-MDA01 assay; in the four format options (see table). The example file is selected by clicking the filename.
Derivative Results
Information regarding the derivative analysis of the current data set is provided
in Derivative Results.
File name The file name for the current data set.
File size The file size, in bytes, of the data set.
Sample Count The number of columns (xy data pairs) in the data set.
Data points The total number of rows (x) in the data set.
Sample ID The column header or sample identifier for the xy data
pair.
Derivative Peak The wavelength and peak height at maximum value of the derivative curve. This value is determined by finding the ymax starting from the right side of the derivative curve. Because derivative spectra have symmetrical positive and negative peaks, only the positive peak is selected. To select the negative peak, set the Scale factor to negative. This inverts the derivative spectra and results in the "negative" peak being selected.
Graphs Following clicking the , the data set and derivative parameters are submitted for calculation. In addition to the derivative peak (above), plots of the zero order spectrum, convolution key and derivative spectrum are dynamically created and displayed.
Pointer The approximate value of the xy pair of the original and derivative can be found by placing the cursor directly over the point on the plot. This xy value is displayed immediately below the graph.
Data list Below the original data and derivative plots, the xy data pairs used to generate the plots are displayed in a scrollable list. The derivative data can be downloaded as a comma separated file (i.e., Excel comparable) by clicking on found in the upper right of the display.
Data Sets
Data Set The derivatives of the entire data set are calculated by clicking on and the first absorption spectra is displayed by default. Individual absorption spectra can be view by selecting the spectra of interest from the select list and clicking on .
Calibration and Interpolation
For systems in which the absorbance of the analyte is linear with respect to concentration, the derivative of the absorbance will also be linear. To calibrate and interpolate analyte concentrations, click on . The calibration curve requires the calibrator values to be supplied to the application. These values are entered as a comma separated list in the input box provided. There must be at least 3 calibrator concentrations. For example, the NWLSS™ NWK-MDA01 assay uses 5 calibrators from 0-4 µM. The calibrator input list would therefore be 0,1,2,3,4. The order of the calibrators in the list is not important nor do the calibrator replicates need to be the same.
Calibrator Assignment Table Upon entering the calibrator list, the Calibrator Assignment Table is displayed as an input table consisting of a list of each sample ID followed by a series of radio buttons representing the just entered calibrator list. Click on the appropriate calibrator value to assign that value to the sample. If a radio button is selected by mistake, click the "Off" button; otherwise. non-calibrator samples can be ignored.
Calculate Button Upon clicking on , the calibration curve parameters are determined using linear regression of the peak height on wavelength. The estimated analyte concentrations are then interpolated from the calibration curve.
Results
The Calibration Curve, Calibration Data, Regression Coefficients and Interpolation of sample concentrations are displayed. Clicking will save the results to a comma separated file (i.e. Excel compatible) that can be opened or saved by the local computer.