Analytical Methods for Resolving Data From TBA2-MDA Reaction Mixtures
The NWK-MDA01 lipid peroxidation assay is based on the reaction of malondialdehyde (MDA) with thiobarbituric acid (TBA); forming a MDA-TBA2 adduct that absorbs strongly at 532 nm, as shown in Figure 1. This reaction is the most popular method for estimating MDA in biological samples.

Figure 1.Reaction of TBA with MDA forming the 532 nm chromophore.
However, biological samples reacted with TBA typically do not yield a clean spectra making analysis difficult. Because of this, commercial or "home brew" assays that fail to address the issue can be prone to error. For this reason, the NWLSS™ method incorporates analytical improvements designed to minimize errors asociated with these types of measurements.
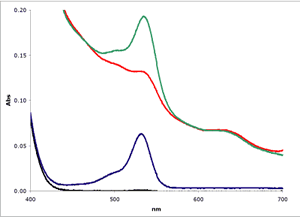
Muscle (■)
Muscle plus MDA(■)
1 µM MDA in buffer(■)
Buffer only(■)
As can be seen in Figure
2, biological
samples can show a severe non-linear baseline complicating the estimation of
MDA. In this example, a bovine muscle sample was
homogenized in Assay Buffer and tested using the NWK-MDA01 standard method.
To enhance the signal for the example, a known amount of MDA was added
to the muscle homogenate.
Since appropriate analysis of the spectrophotometric data is essential to the success in estimating MDA in a complex biological sample, this technical bulletin describes four successively improving methods that can be used to calculate the MDA concentration.
- Single Wavelength
- Zero Adjusted
- Jentzsch Method
- Derivative Analysis
To test the various analytical methods, muscle samples were assayed using the NWK-MDA01 standard method, with and without chloroform extraction. Calibrators and sample spectra were collected over 400-700 nm and analyzed. Again, Figure 2 above shows a graphical representation of the zero order plots of the reaction mixtures, including the 1 µM MDA Calibrator and Buffer only blank. Details of results using each analytical method are tabulated in Table 1 and a graphical overview of the results showing TBA/Sample Reaction, Sample Blank and Calculated MDA are shown in Figure 3.
| Sample A | Sample B | ||||||||
|---|---|---|---|---|---|---|---|---|---|
| Key | Method | TBA | Blk | TBA-Blk | %Blk | TBA | Blk | TBA-Blk | %Blk |
| 1 | Direct 532 nm | 13.2 | 13.4 | -0.2 | 102 | 7.2 | 5.7 | 1.5 | 80 |
| 2 | 532 nm, Extracted | 2.7 | 1.2 | 1.6 | 42 | 1.8 | 0.8 | 1.1 | 42 |
| 3 | Pre-scan instrument zero | 7.6 | 6.5 | 1.1 | 86 | 4.7 | 3.1 | 1.6 | 67 |
| 4 | Pre-scan instrument zero, Extracted | 2.4 | 1.0 | 1.4 | 42 | 1.7 | 0.7 | 1.0 | 39 |
| 5 | Jentzsch | 3.7 | 2.5 | 1.2 | 67 | 2.3 | 1.2 | 1.1 | 51 |
| 6 | Jentzsch Extracted | 1.8 | 0.5 | 1.3 | 26 | 1.2 | 0.3 | 0.9 | 21 |
| 7 | Botsoglou | 1.5 | 0.3 | 1.2 | 17 | 1.3 | 0.1 | 1.1 | 10 |
| 8 | Botsoglou Extracted | 1.5 | 0.1 | 1.1 | 7 | 1.1 | 0.1 | 1.0 | 5 |
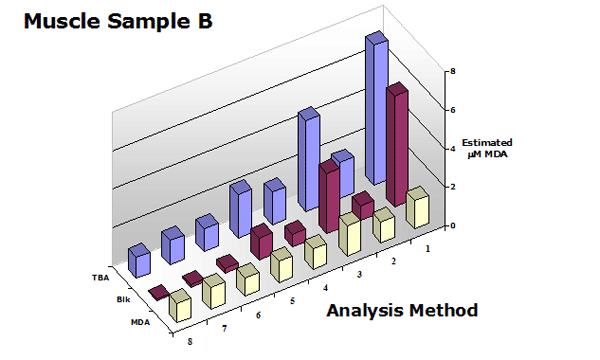 Figure 3. Summary of the estimated MDA in
a muscle sample (with and without chloroform extraction) using analytical methods shown in Table 1.
These data clearly show that the use of a sample blank is required for all TBA2-MDA analytical procedures with the exception of 3rd-derivative analysis. Extraction of the reaction mixture with an organic solvent is optional but improves all procedures.
Experimental Details
MDA Calibrators:
Four concentrations of MDA in buffer system were reacted with TBA using the
NWK-MDA01 standard method. The spectra produced by the TBA2-MDA adduct,
without and with chloroform extraction, are shown in Figure
4 and Figure 5, respectively.
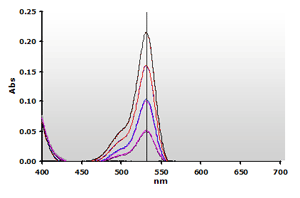 Figure
4. Spectra from the reaction of TBA with MDA calibrators:
0(—), 1(—),
2(—), 3(—)
and 4(—) µM, respectively. Figure
4. Spectra from the reaction of TBA with MDA calibrators:
0(—), 1(—),
2(—), 3(—)
and 4(—) µM, respectively. |
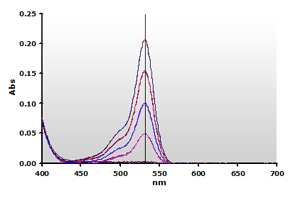 Figure
5. Spectra from the reaction of TBA with MDA calibrators,
followed by chloroform extraction: 0(—),
1(—), 2(—),
3(—) and 4(—) µM,
respectively. Figure
5. Spectra from the reaction of TBA with MDA calibrators,
followed by chloroform extraction: 0(—),
1(—), 2(—),
3(—) and 4(—) µM,
respectively. |
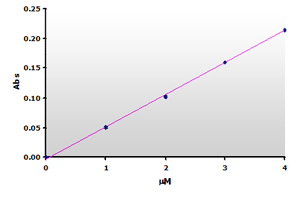 Figure
6. The calibration curve was generated by plotting the peak
heights at 532 nm obtained from the Figure 4, above. Figure
6. The calibration curve was generated by plotting the peak
heights at 532 nm obtained from the Figure 4, above. |
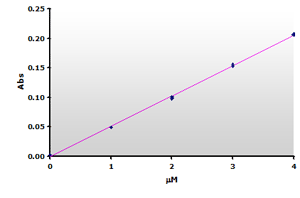 Figure
7. The
calibration curve was generated by plotting the peak heights at 532 nm
obtained from the Figure 5, above. Figure
7. The
calibration curve was generated by plotting the peak heights at 532 nm
obtained from the Figure 5, above. |
Regression analysis of the 532 nm peak heights produce linear response curves directly proportional to the MDA concentration; generating the calibration equation data shown in Table 2.
| Slope | Intercept | r2 | Syx | MLD | |
|---|---|---|---|---|---|
| Non-extracted | 0.0543 | -0.0036 | 0.9991 | 0.0025 | 0.0936 |
| Extracted | 0.0513 | -0.0002 | 0.9991 | 0.0024 | 0.0953 |
Muscle Sample Handling
Two bovine muscle samples were homogenized in the presence of BHT and assayed using the NWK-MDA01 standard method. Each muscle sample was also run with water substituted for TBA to create a sample blank. Contrary to the Calibrator spectra above, the spectra obtained from the complex muscle in Figure 8 (Non Extracted) shows a high amplitude offset and a non-linear baseline. Note that plasma samples will also exhibit a similar baseline increase. Chloroform extracted samples (Figure 9) yield cleaner spectra but by itself this is still insufficient to totally resolve the data.
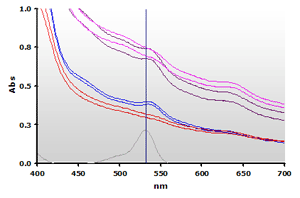 Figure 8. Spectra
from the reaction mixtures of muscle homogenates A and B, ±TBA:
A+(—), A-(—),
B+(—),
B-(—) and 4µM MDA(—), respectively.
 |
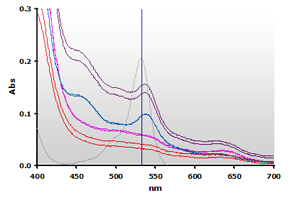 Figure 9. Spectra
from the chloroform extracted reaction mixtures of the muscle homogenates
A and B, ±TBA: A+(—),
A-(—), B+(—),
B-(—) and 4µM MDA(—),
respectively.
 |
Analytical Methods Comparison
Single Wavelength (ABS532) Method
The simplest, and least useful analysis is to simply measure the absorbance at
532 nm. Examining Figure 8 above,
it is obvious that the use of an uncorrected 532 nm value will not produce
meaningful estimation of the MDA in the sample. Note that for Sample A,
the blank (A-)has an average A532 greater
than the TBA sample which results in a negative concentration for MDA. With
the inclusion of a sample blank, chloroform extraction of the reaction mixtures
improves the results but they are still not satisfactory.
| Sample | Non-extraction | Extraction | ||||||||
|---|---|---|---|---|---|---|---|---|---|---|
| 532 nm | MDA | Avg | Net | %Blk | 532 nm | MDA | Avg | Net | %Blk | |
| A+1 | 0.6782 | 12.57 | 13.18 | -.020 | 102 | 0.1526 | 2.88 | 2.74 | 1.58 | 42 |
| A+2 | 0.7447 | 13.79 | 0.1373 | 2.60 | ||||||
| A-1 | 0.6962 | 12.90 | 13.38 | 0.0585 | 1.15 | 1.16 | ||||
| A-2 | 0.7483 | 13.86 | 0.0601 | 1.17 | ||||||
| B+1 | 0.3799 | 7.07 | 7.22 | 1.48 | 80 | 0.9858 | 1.83 | 1.82 | 1.07 | 42 |
| B+2 | 0.3960 | 7.37 | 0.0416 | 1.81 | ||||||
| B-1 | 0.3188 | 5.94 | 5.74 | 0.0946 | 0.83 | 0.76 | ||||
| B-2 | 0.2967 | 5.53 | 0.0332 | 0.68 | ||||||
Zero Adjusted A532 Method
Simply subtracting the absorbance at 700 nm to normalize the offset sample baseline relative to the calibrators also works to improve
the spectra as Shown in figure 10.
This also unambiguously illustrates the non-linearity of the spectra.
After zero adjusting the data it is apparent that additional factors act to contribute to the non-specific absorbance at 532 nm.
It is also apparent that a sample blank will be required to achieve a reasonable estimate of the MDA concentration.
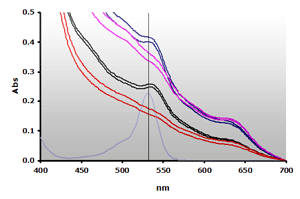 Figure 10. Spectra obtained from the reaction of muscle homogenates A and B, ±TBA. The absorbance at 700 nm was subtracted from the individual spectra: A+(—), A-(—), B+(—), B-(—) and 4µM MDA(—), respectively.
|
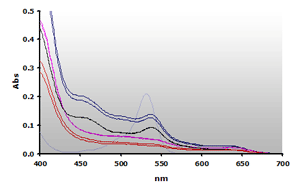 Figure 11. Spectra
obtained from the chloroform extracted reaction mixtures of of muscle
homogenates A and B, ±TBA. The
absorbance at 700 nm was subtracted from the individual spectra:
A+(—),
A-(—), B+(—),B-(—) and 4µM MDA(—),
respectively.
|
| Sample | Non-extraction | Extraction | ||||||||
|---|---|---|---|---|---|---|---|---|---|---|
| 532 nm | MDA | Avg | Net | %Blk | 532 nm | MDA | Avg | Net | %Blk | |
| A+1 | 0.6782 | 7.43 | 7.59 | 1.06 | 86 | 0.1526 | 2.54 | 2.43 | 1.40 | 42 |
| A+2 | 0.7447 | 7.74 | 0.1373 | 2.32 | ||||||
| A-1 | 0.6962 | 6.27 | 6.23 | 0.0585 | 1.02 | 1.03 | ||||
| A-2 | 0.7483 | 6.78 | 0.0601 | 1.04 | ||||||
| B+1 | 0.3799 | 4.60 | 4.69 | 1.57 | 67 | 0.0958 | 1.69 | 1.62 | 1.04 | 39 |
| B+2 | 0.3960 | 4.78 | 0.0946 | 1.7 | ||||||
| B-1 | 0.3188 | 3.30 | 3.13 | 0.0416 | 0.65 | 0.63 | ||||
| B-2 | 0.2967 | 2.96 | 0.0332 | 0.61 | ||||||
Jentzsch Correction Method
Jentzsch (FRBM 20:251-256; 1996) improved the estimation of
MDA by using the difference in absorbances at 535 and 572 nm from spectra generated
from a butanol extract of the reaction mixture.
For comparison, the Jentzsch method was applied to unextracted reaction mixtures and the results were tabulated in Table 5.
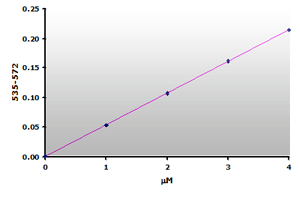 Figure 12.
The calibration curve is generated by plotting
the difference from ABS535 to ABS572.
 |
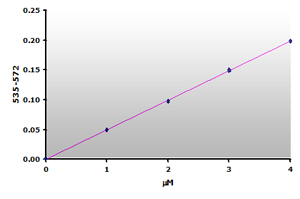 Figure 13.The calibration curve is generated by plotting
the difference from ABS535 to ABS572.
 |
| Sample | Non-extraction | Extraction | ||||||||
|---|---|---|---|---|---|---|---|---|---|---|
| 535-572 nm | MDA | Avg | Net | %Blk | 535-572 nm | MDA | Avg | Net | %Blk | |
| A+1 | 0.1966 | 3.66 | 3.66 | 1.19 | 67 | 0.0923 | 1.85 | 1.76 | 1.30 | 26 |
| A+2 | 0.1962 | 3.66 | 0.0829 | 1.66 | ||||||
| A-1 | 0.1278 | 2.38 | 2.47 | 0.0232 | 0.45 | 0.46 | ||||
| A-2 | .1377 | .2.56 | 0.0241 | 0.47 | ||||||
| B+1 | 0.1205 | 2.24 | 2.27 | 1.11 | 51 | .0600 | 1.20 | 1.21 | .9555 | 21 |
| B+2 | 0.1232 | 2.29 | .0604 | 1.21 | ||||||
| B-1 | 0.0642 | 1.19 | 1.15 | .0146 | 0.28 | 0.26 | ||||
| B-2 | .0605 | 1.12 | .0125 | 0.24 | ||||||
Since there is no absorbance at 570 nm for the calibrators, the calibration curve (Figure 12) is essentially the same as the original curve (Figure 6) with possibly a small improvement in sensitivity. However, the muscle sample blanks show that 59% of the calculated MDA is due to the sample interference. Therefore, a reasonable estimate of the MDA concentration still requires that a sample blank be subtracted from the sample when using the Jentzsch method. Unfortunately, the use of sample blanks double the effort and halves the test yield.
As shown by Jentzsch, and shown again in this work an effective method to additionally reduce baseline is to extract the sample reaction mixture in an organic solvent. Figure 9 above shows the spectra of the aqueous layer from the reaction mixture extracted with chloroform.
As seen in the curve data presented in Figures 6 & 7 above, the chloroform extraction has no effect on the calibration curve. There is little difference other than a slight improvement of the sensitivity (Syx). Extraction of the samples however reduces the baseline of the reaction mixture spectra by 3-fold and improves the agreement between the replicates.
The Jentzsch correction with extraction therefore provides an improved estimate for the sample MDA and reduces the contribution of the sample blank but does not eliminate the need for a sample blank.
Derivative Method
As we have already shown, the
spectra obtained from the sample reaction mixtures have a large matrix affect
due to scattering and non-specific absorbing components. As shown above, this effect is not
eliminated by extraction or the two-point Jentzsch correction method. Botsoglou (J.
Agric. Food Chem, 42:1931-1937; 1994) however applied derivative
spectroscopy to the analysis of MDA in complex samples.
Most spectrophotometer software includes an application to perform smoothing and derivative analysis of spectra based on Savitzky-Golay (Anal. Chem. 36:1627-1639; 1964). To the uninitiated, this method can appear to be mysterious and somewhat intimidating so following is a brief primer to explain why this works.
Understanding derivative spectroscopy
The relationship between the TBA2-MDA chromophore and the sample matrix is critical to understanding how derivative spectroscopy can work to improve data.
Briefly, for a Gaussian band (see Figure 2), the amplitude
(A) of the band is inversely proportional to the bandwidth (W) raised to the
nth order of the derivative.
The TBA2-MDA component has a natural bandwidth of 28 nm and if the baseline is considered a matrix component with a broad bandwidth, say 300 nm, then the relative amplitudes of the TBA2-MDA to baseline, as a function of the derivative order, will be:
| TBA2-MDA = 28 nm Baseline = 300 nm |
|
|---|---|
| Derivative Order | Ratio |
| 0 | 1 |
| 1 | 11 |
| 2 | 115 |
| 3 | 1230 |
| 4 | 13178 |
Put another way, due to the narrow bandwidth of the subject chromophore relative to the overall sample matrix, derivative analysis allows matrix absorbance values to approach zero while leaving TBA2-MDA values still measureable and discernable from one sample or calibrator to another.
The 3rd-order derivative used by the NWK-MDA01 method results in a 1,230-fold increase in the discrimination between the baseline and the TBA2-MDA absorbances at 532 nm.
3rd-derivative Caliration
Figure 14 and Figure
15 show the
3rd-derivative spectra for the non-extracted and extracted MDA calibrators, respectively.
The 3rd-derivatives were calculated using software supplied with the Varian
WinUV software application setting the Filter = 29, data Interval
= 3 and resolution at 1 nm. Any equivalent software application can be used, including whatever was supplied standard with the end-users instrumentation or even MicroSoft
Excel (contact NWLSS Technical Service).
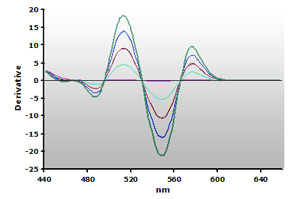 Figure 14. Spectra
from the reaction of TBA with calibrators: 0(—),
1(—), 2(—),
3(—) and 4(—) µM,
respectively.
 |
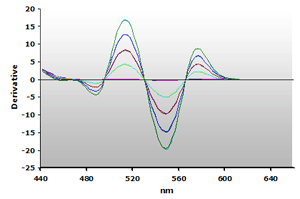 Figure 15. Spectra
from the reaction of TBA with calibrators: 0(—),
1(—), 2(—),
3(—) and 4(—) µM,
respectively.
 |
Plotting the 3rd-derivative as a function of the MDA concentration produces a linear calibration curve shown in Figure 16. Similarly, the extracted calibrator gives a linear calibration curve, Figure 17. Note that the slope of the extracted curve has decreased 7-8% and reflects the baseline improvement for the calibrators.
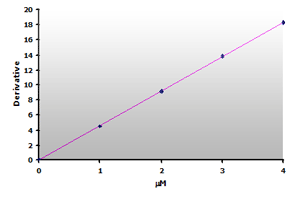 Figure 16.
The calibration curve is generated by plotting
the derivative peak at 514 nm obtained from Table
7.
 |
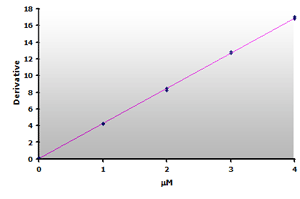 Figure 17.
The calibration curve is generated by plotting
the derivative peak at 514 nm obtained from Table
7.
 |
|
|
||||||||||||||||||||||||||||||||||||||||||||||||||||||||||||||||||||||||||||||||||||||||
Muscle sample
The 3rd-derivative spectra for the non-extracted and extracted muscle samples, ±TBA, are shown in Figure 18 and Figure 19, respectively. There is a peak shift from 514 nm to 520 nm in these samples. The estimation of the MDA concentration used the 520 nm peak value.
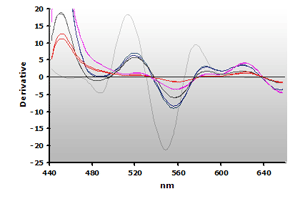 Figure 18. Spectra
from the reaction of TBA with calibrators: 0(—),
1(—), 2(—),
3(—) and 4(—) µM,
respectively.
 |
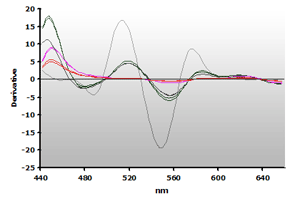 Figure 19. Spectra
from the reaction of TBA with calibrators: 0(—),
1(—), 2(—),
3(—) and 4(—) µM,
respectively.
 |
|
|