NWLSS™ Malondialdehyde Assay Protocol
Product Insert for NWK-MDA01 Malondialdehyde Assay
NWLSS |
-
Assay Protocols
- Malondialdehyde Assay
- Introduction
- Intended Use
- Test Principle
- General Specifications
- Kit Contents
- Required Materials Not Provided
- Required Instrumentation
- Warnings & Precautions
- Storage Instructions
- Assay Preparation
- Reagent Preparation
- Sample Handling/Preparation
- Assay Protocol
- Data Analysis
- Performance Details
- Things To Note
- References
- Procedure Checklist
- Statement of Limited Warranty
Malondialdehyde (MDA) Assay Kit: 200 Tests
rev111507a
Introduction:
Polyunsaturated fatty acids (PUFA) that contain 2 or more double bonds are particularly susceptible to oxidation by free radicals and other highly reactive species. In brief, an allylic hydrogen is abstracted by a reactive species, such as the hydroxyl radical (HO•), resulting in the formation of lipid peroxyl radicals (LOO•). This radical can then react with a second PUFA, forming a lipid hydoperoxide (LOOH) and a second LOO•, resulting in the propagation of the lipid oxidation. Alternatively, LOO• can attack an intramolecular double bond and form a cyclic endoperoxide which decomposes to malondialdehyde.1,2
Malondialdehyde (MDA) is one of many low molecular weight end-products of lipid hydoperoxide decomposition and is the most often measured as an index of lipid peroxidation.3 However, the use a MDA as a marker for lipid peroxidation is controversial. MDA can be formed during eicosanoid metabolism and the analytical methods for measuring MDA are prone to artifactual errors.4 The NWLSS™ MDA assay conditions have been designed to minimize errors in the determination of MDA concentration.
Intended Use:
The NWLSS™ Malondialdehyde Assay is used to measure the concentration of MDA in a variety of animal and plant samples.
Test Principle:
The NWK-MDA01 assay is based on the reaction of MDA with thiobarbituric acid (TBA); forming an MDA-TBA2 adduct that absorbs strongly at 532 nm.
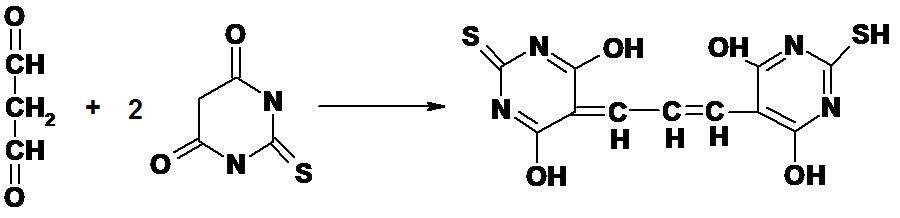
Figure 1.
Reaction between MDA and TBA.
Butylated hydroxytoluene (BHT) and EDTA are added to the sample and reaction mixture to minimize oxidation of lipids that contribute artifactually during sample processing and the TBA reaction.5,6 The temperature of the reaction mixture has also been reduced to minimize the decomposition of lipid hydroperoxides. Because much of the MDA is protein bound, mostly as a Schiff base, the pH of the reaction has been optimized to facilitate hydrolysis of the MDA.7 Additionally, the reaction mixture is subjected to derivative spectrophotometric analysis that resolves the problem of the variable and nonlinear baseline observed when attempting to measure the A532 absorbance in various biological samples (see Data Analysis).
General Specifications:
- Format:
- Spectrophotometric
- Number of tests:
- 200
- Specificity:
- Malondialdehyde
- Sensitivity:
- Processed Sample = 0.08 µM
Reaction Mixture = 0.03 µM
Kit Contents:
- TBA Reagent
- 2-Thiobarbituric acid, dry powder, 5 bottles
- BHT Reagent
- Butylated hydroxytoluene in ethanol, 2.0 mL vial
- Acid Reagent
- 1M Phosphoric acid, 5 x 10 mL bottles
- Assay Buffer
- Phosphate buffer, pH 7.0 with EDTA, 125 mL bottle
- Calibrators:
- Tetramethoxypropane in a stabilizing buffer at 4,3,2,1 and 0 µM MDA equivalents; 2.5 mL each
Required Materials Not Provided:
- Adjustable pipettes capable of 10 and 250 µL volumes
- Pipette tips for 10 and 250 µL volumes
- Stir bar, 1/8 inch (0.3 cm) or similar
- Polypropylene microcentrifuge tubes
- Semi-micro cuvettes (plastic glass or quartz)
- Deionized water
Required Instrumentation:
- Spectrophotometer
- Vortex mixer
- Magnetic stirrer (recommended)
- Dry heating block or water bath set to 60°C
- Microcentrifuge
Warnings & Precautions:
2-Thiobarbituric Acid (TBA, CAS 504-17-6) has a strong mercaptan odor. Do not breathe dust. Avoid contact with skin and eyes.
Phosphoric Acid (CAS 7664-38-2) is corrosive and can cause burns. In case of contact with eyes, rinse immediately with copious amounts of water and seek medical advice. Wear suitable protective clothing.
Butylated hydroxytoluene (2,6-di-tert-butyl-4-methylphenol, BHT, CAS 128-37-0) is harmful if swallowed and irritating to the eyes, respiratory system and skin. In case of contact with eyes, rinse immediately with copious amounts of water and seek medical advice. Wear protective clothing.
Storage Instructions:
Store all reagents at 2-8°C.
Reconstituted TBA Reagent is stable for at least 1 week when stored at room temperature. Do not refrigerate.
Assay Preparation
- Spectrophotometer
-
Wavelength: 400-700 nm
Spectral bandwidth: ≤ 2 nm
Resolution: ≤ 1 nm - Heat block or water bath preheated to 60°C
Reagent Preparation:
TBA Reagent
Add 10.5 mL deionized water to the TBA bottle. Insert magnetic stir bar and mix until TBA has dissolved; approximately 10 minutes. Store at room temperature, do not refrigerate.
Other Reagents
The Acid Reagent, BHT Reagent, Assay Buffer and Calibrators are supplied ready-to-use.
Sample Handling/Preparation:
The multi-disciplinary interest in measuring MDA has resulted in a myriad of sample types and experimental conditions and is beyond the scope of this product insert to describe sample processing in detail. However, general guidelines are provided below for representative sample types. Please contact NWLSS to discuss the particular sample under investigation.
Tissue
Hemoglobin may interfere with the assay; therefore, if practical, blood should be removed by perfusion with an appropriate buffer, such as phosphate buffered saline containing heparin. Prepare a 10% w/v homogenate in cold Assay Buffer or other buffer. Clarify the homogenate by centrifugation and store the supernatant on ice. The MDA concentration can be normalized to the wet weight of the tissue sample or to the protein concentration of the homogenate.
Plasma
Blood, using EDTA, heparin or other anticoagulant, should be kept cold and the plasma separated as soon as possible after being drawn. It is important to minimize hemolysis. Plasma can be assayed without further processing. Note that the MDA concentration in normal plasma is at the limits of sensitivity for the assay.
Urine
Urine samples should be stored at -20°C (-70°C long term storage). Upon thawing, the sample must be clarified by centrifugation prior to assay. The MDA concentration can be normalized to the creatinine concentration or other appropriate marker. NWLSS™ NWK-CTN01 can be used to measure creatinine.
Assay Protocol
- Add 10 µL BHT Reagent to microcentrifuge vial
- Add 250 µL Calibrator or sample to vial
- Add 250 µL Acid Reagent to vial
- Add 250 µL TBA Reagent to vial
- Vortex vigorously (5-count)
- Incubate 60 minutes at 60°C
- Centrifuge at 10,000 xg for 2-3 minutes
- Transfer reaction mixture to cuvette
- Record spectra from 400-700 nm
- Perform 3rd derivative analysis (recommended) or other analytical method.
Data Analysis
The following example shows the expected behavior and results of MDA determinations on a biological sample using the standard method of the NWLSS™ MDA assay.
A sample of bovine muscle was homogenized in Assay Buffer. To enhance the signal for this example, a known amount of MDA (hydrolyzed TMOP) was added to the muscle homogenate and then assayed using the standard method. Figure 2 shows the zero order plots of the reaction mixtures including the 1 µM MDA Calibrator and blank for reference (the other calibrators and replicates are not shown for clarity).
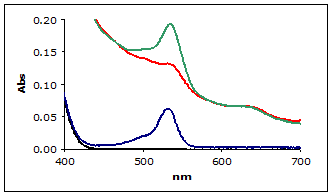
Figure 2.
(■) Zero order plot of MDA Calibrator
(■) Muscle homogenate
(■) Muscle homogenate with added MDA
(■) Blank
As can be seen in the figure 2, the muscle homogenate shows a severe non-linear baseline making it difficult to estimate the A532 absorbance for the homogenate. This is typical of TBA reactions with biological samples.
Therefore the preferred method to calculate the MDA concentration in biological samples is by derivative analysis of the spectra for the reaction mixture.5 Derivative spectroscopy applications are provided by most spectrophotometer software. These data were analyzed using the Math Application supplied in the Cary Win UV version 3.0 software. The Filter Size was set to 29 nm and the Interval set to 3 nm. For convenience, the derivative is multiplied by -1x10⁶ to provide a more convenient number.
Figure 3 shows the plot of the 3rd-derivative as a function of wavelength. As can be seen, the derivative easily resolves the MDA-TBA2 peak.
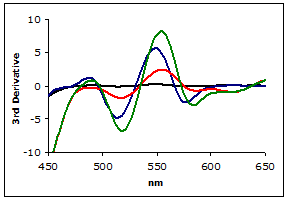
Figure 3.
Plot of the 3rd Derivaties of scans from Figure 2

Table 1
Calibrator data of 3rd derivative peaks at 514 nm.
Plotting the third derivative peak at 514 nm as a function of MDA concentration produces a linear calibration curve as shown in Figure 4.
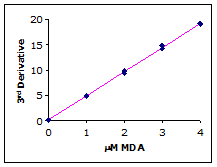
Figure 4.
Example calibration curve
Simple linear regression of the 3rd-derivative vs. µM MDA yields the calibration equation:

- Slope
- 5.481
- Intercept
- 0.1447
- r2
- 0.9993
- Syx
- 0.2280
Continuing the example, the 3rd-derivative for the muscle homogenate sample was 1.831. Solving for [MDA]…

Performance Details:
Sensitivity:
The sensitivity of the NWK-MDA01 assay is defined as the MDA concentration obtained from 2-times the standard error of the calibration curve or 0.08 µM in the prepared sample or 0.03 µM in the reaction mixture.
Accuracy:
Recovery: The recovery of MDA (hydrolyzed TMOP) and TMOP added to a muscle homogenate is shown in Table 2.

Recovery of MDA added to muscle homogenates and Assay Buffer.
The recovery of less than 100% can be attributed to the tendency of MDA to undergo several reactions in a complex sample that are not reversible by acid hydrolysis.1
Dynamic Range:
The linearity and sensitivity of the calibration curve defines the useful range of the assay. As can be seen in Figure 5, the calibration curve is linear to 11 µM MDA. The standard method can measure up to 50 µM MDA but those concentrations will not be found in most biological samples. Therefore, the useful range of the NWLSS MDA assay is 0.1 to 10 µM.
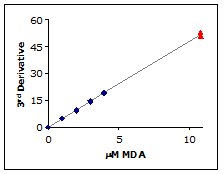
Figure 5.
The 3rd derivative of a 10.8 µM MDA sample (▲) was determined using the standard method and plotted against the calibration curve (♦).
Stability
All unopened reagents are stable until the expiration date stated on the package label when stored at 2-8°C.
Things to Note:
References:
- Halliwell, B.; Gutteridge, J.M.C. Free Radicals in Biology and Medicine. Oxford University.
- Esterbauer, H., et.al., Chemistry and Biochemistry of 4-Hydroxynonenal, malondialdehyde and Related Aldehydes, Free Rad. Biol. Med. 11:81-128; 1991).
- de Zwart, L.L., et.al., Biomarkers of Free radical Damage Applications in Experimental Animals and Humans, Free Rad. Biol. Med. 26:202-226; 1999.
- Janero, D.R. Malondialdehyde and thiobarbituric acid-reactivity as diagnostic indices of lipid peroxidation and peroxidative tissue injury, Free Rad. Biol. Med. 9:515-540; 1990.
- Botsoglou, N.A., Rapid, Sensitive, and Specific Thiobarbituric Acid Method for Measuring Lipid Peroxidation in animal Tissue, Food and Feedstuff Samples, J. Agric. Food Chem. 42:1931-1937; 1994.
- Jentzsch, A. M., et.al., Improved Analysis of Malondialdehyde in Human Body Fluids, Free Rad. Biol. Med. 20:251-256; 1996.
- Gerard-Monnier, D., et.al., Reactions of 1-methyl-2-phenylindole with malondialdehyde and 4-hydroxylalkenals. Analytical applications to a colorimetric assay of lipid peroxidation, Chem. Res. Toxicol. 11; 1184-1194; 1997.
- Carbonneau, M.A., et.al. Free and Bound Malondialdehyde Measured as Thiobarbituric Acid Adduct by HPLC in Serum and Plasma, Clin. Chem. 37:1423-1429; 1991.
- Lykkesfeldt, J., Determination of Malondialdehyde as Dithiobarbituric Acid Adduct in Biological Samples by HPLC with Fluorescence Detection: Comparison with Ultraviolet-Visible Spectrophotometry, Clin. Chem. 47:1725-1727; 2001.
- Yagi, K., Simple Procedure for Specific Assay of Lipid Hydroperoxides in Serum or Plasma, Free Radical and Antioxidant Prot. 108:101-106; 1998.
Procedure Checklist:
___Process the sample and place on ice
___Preheat heat block or water bath to 60°C
___Reconstitute TBA Reagent with 10.5 mL deionized water
___Add 10 µL BHT Reagent to microcentrifuge vial
___Add 250 µL Calibrator or sample to microcentrifuge vial
___Add 250 µL Phosphoric Acid Reagent to microcentrifuge vial
___Add 250 µL TBA reagent to microcentrifuge vial
___Cap and vortex (to 5 count)
___Place at 60°C for 60 minutes
___Setup spectrophotometer
___Centrifuge at 10,000 xg for 2-3 minutes
___Scan each reaction mixture; 400-700 nm
___Analyze data
Statement of Limited Warranty:
Northwest Life Science Specialties, LLC (NWLSS) makes no guarantee of any kind, expressed or implied, that extends beyond the description of the material in this kit, except that they will meet our specifications at the time of delivery. Customer's remedy and NWLSS’ sole liability is limited to, at NWLSS’ option, refund of the purchase price, or the replacement of material not meeting our specification. By acceptance of our product, customer assumes all liability and will indemnify and hold NWLSS harmless for the consequence of this product’s use or misuse by the customer, its employees, or others. Refund or replacement is conditioned of customer notifying NWLSS within twenty-one (21) days of the receipt of product. Failure to give notice within 21 days shall constitute a waiver by the customer of all claims hereunder with respect to said product.